Data visualisation
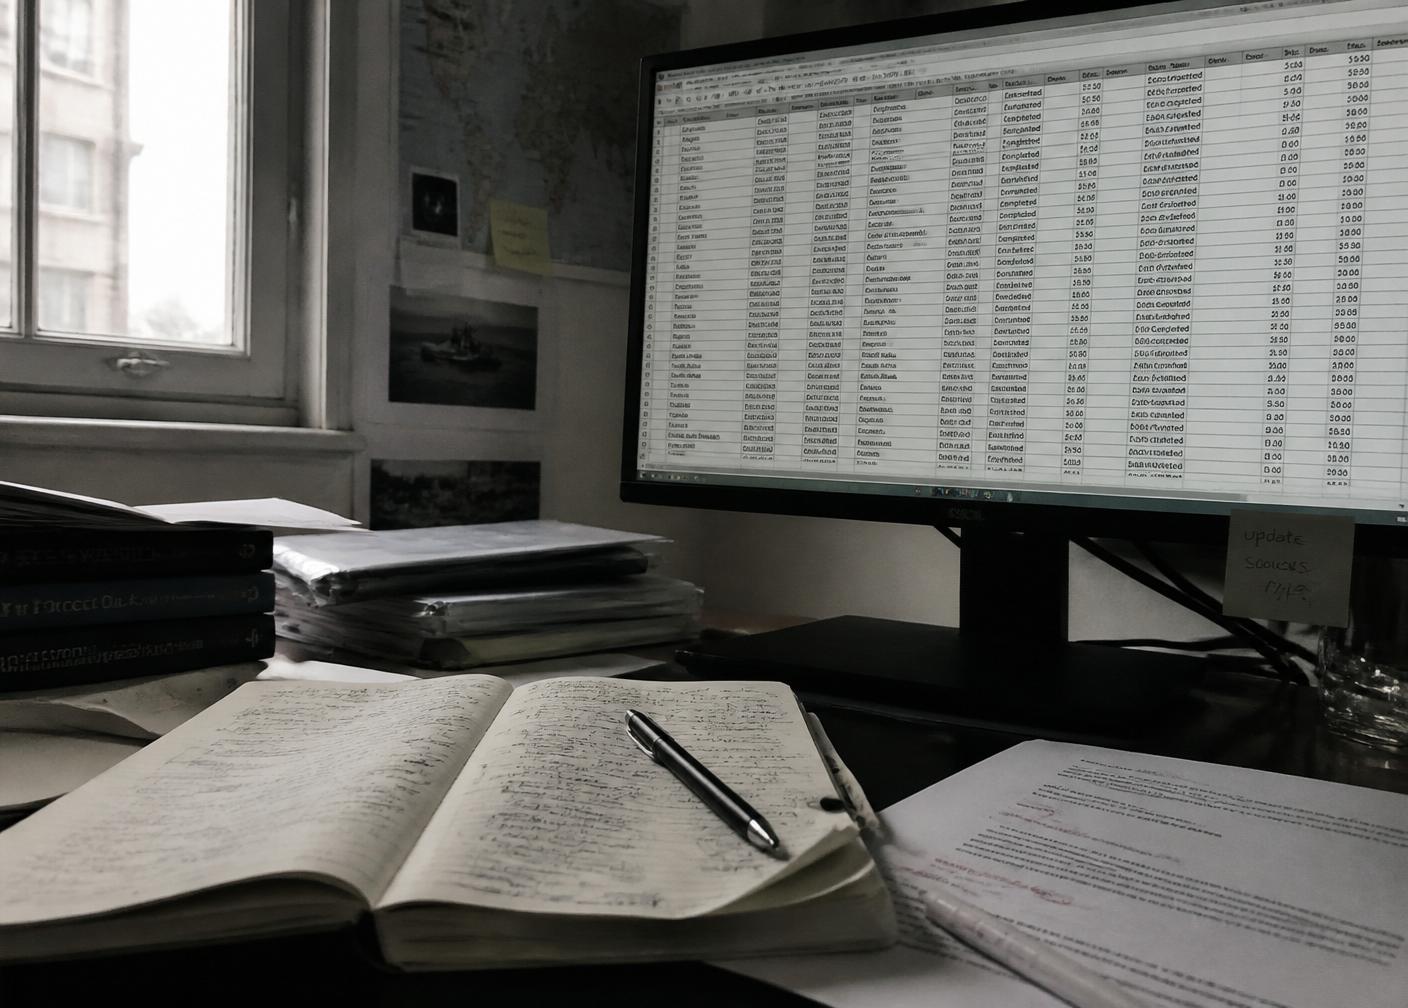
Developing the first visualisations that will accompany PLOT.'s investigations. At this stage the laboratory is structuring workflows, choosing tools and setting standards for publishing interactive charts.
A space for experimenting with formats, exploring databases, testing visualisations and developing methods that also help make sense of a story.
The laboratory documents processes, tools and editorial languages that will eventually be incorporated into the investigations published by PLOT.. It is not a separate space from reporting, but the documentation of the investigative process itself.

Developing the first visualisations that will accompany PLOT.'s investigations. At this stage the laboratory is structuring workflows, choosing tools and setting standards for publishing interactive charts.

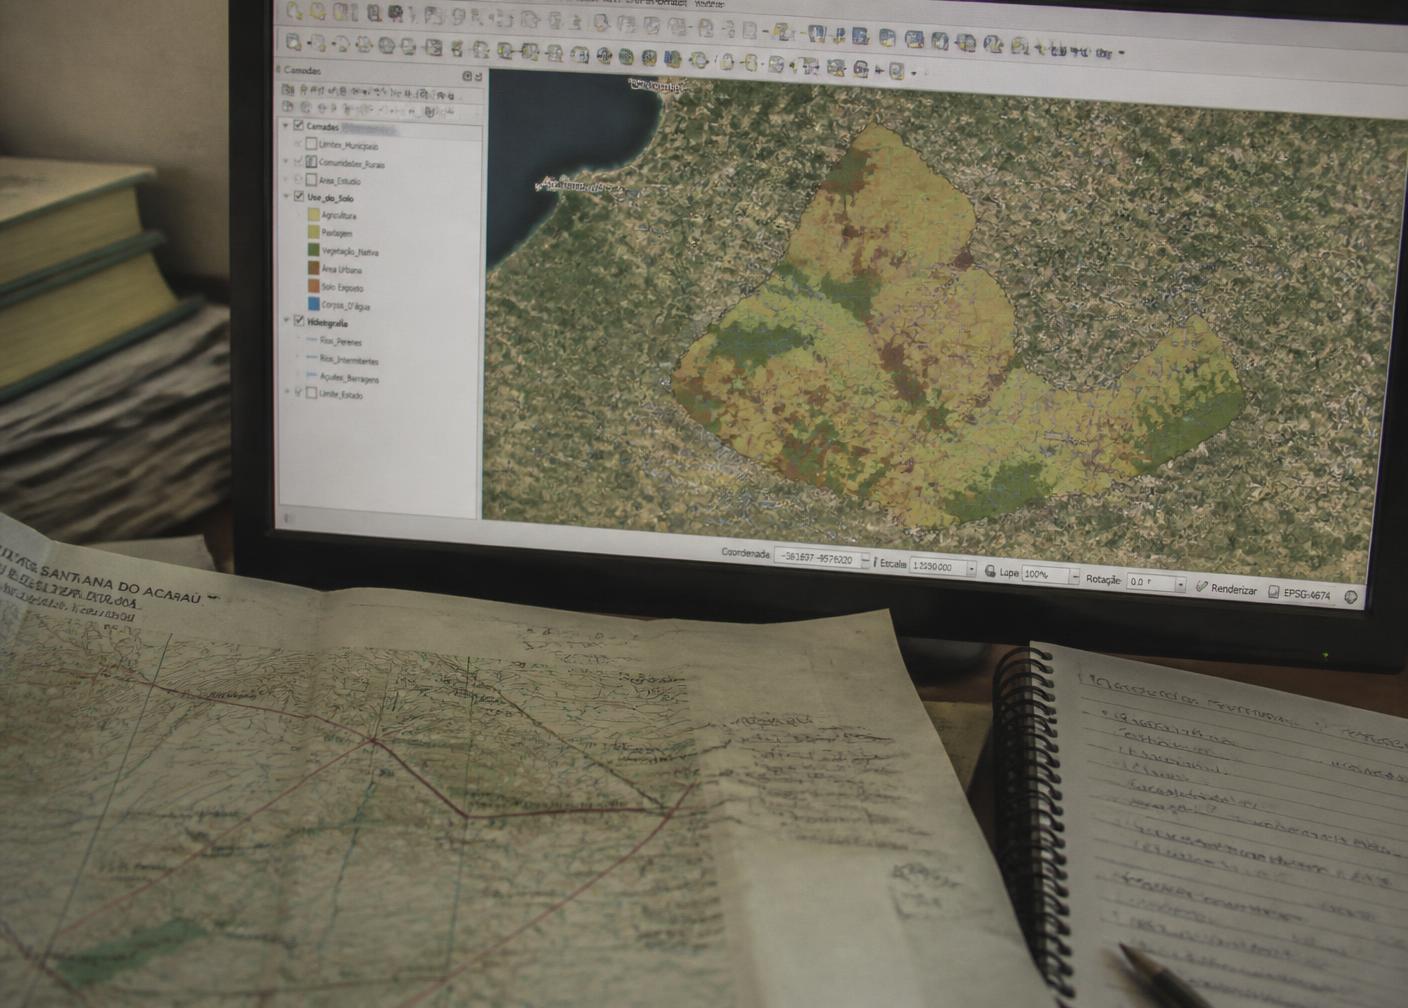
Structuring the first maps produced from geographic databases with tools such as QGIS and Mapbox. The maps will be part of future investigative stories and special projects.

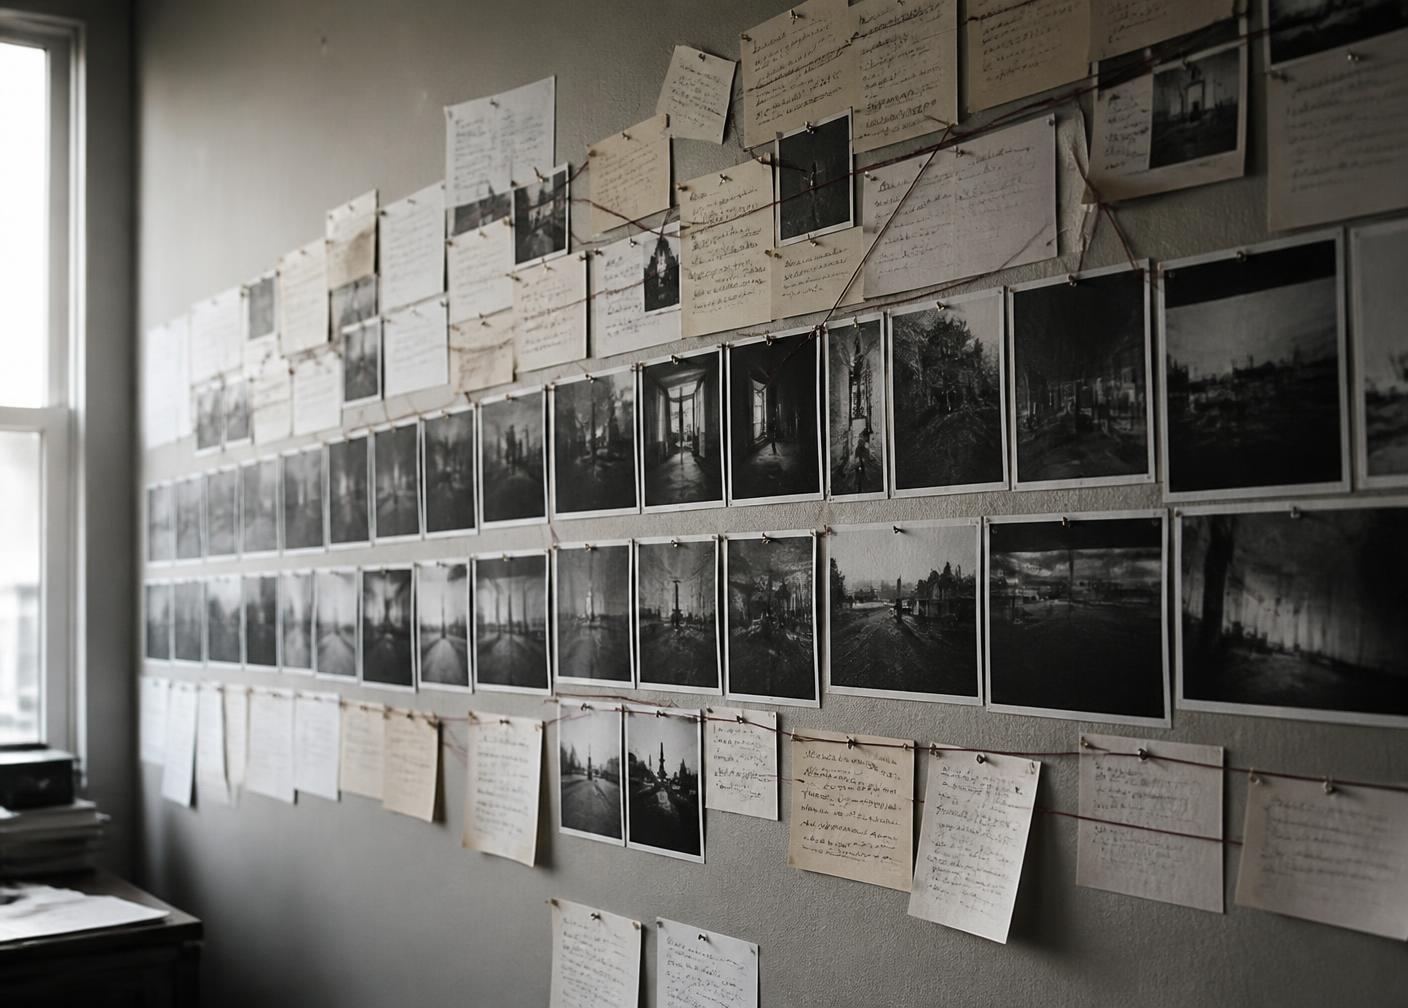
Developing the laboratory's editorial language in order to combine investigation, data, photography, video, cartography and interactive visualisations in long-form stories.